Welcome to your store’s control tower - your Ecurmas Analytics dashboard.
Here, numbers stop being just data - they become insights that help you sell more, spend less, reduce risk, and scale smartly. If you’re serious about growing your online business, it’s not enough to just upload products and wait. You need to understand what’s working, what’s broken, what’s slowing you down, and where to focus next - and that’s exactly what this analytics dashboard reveals.
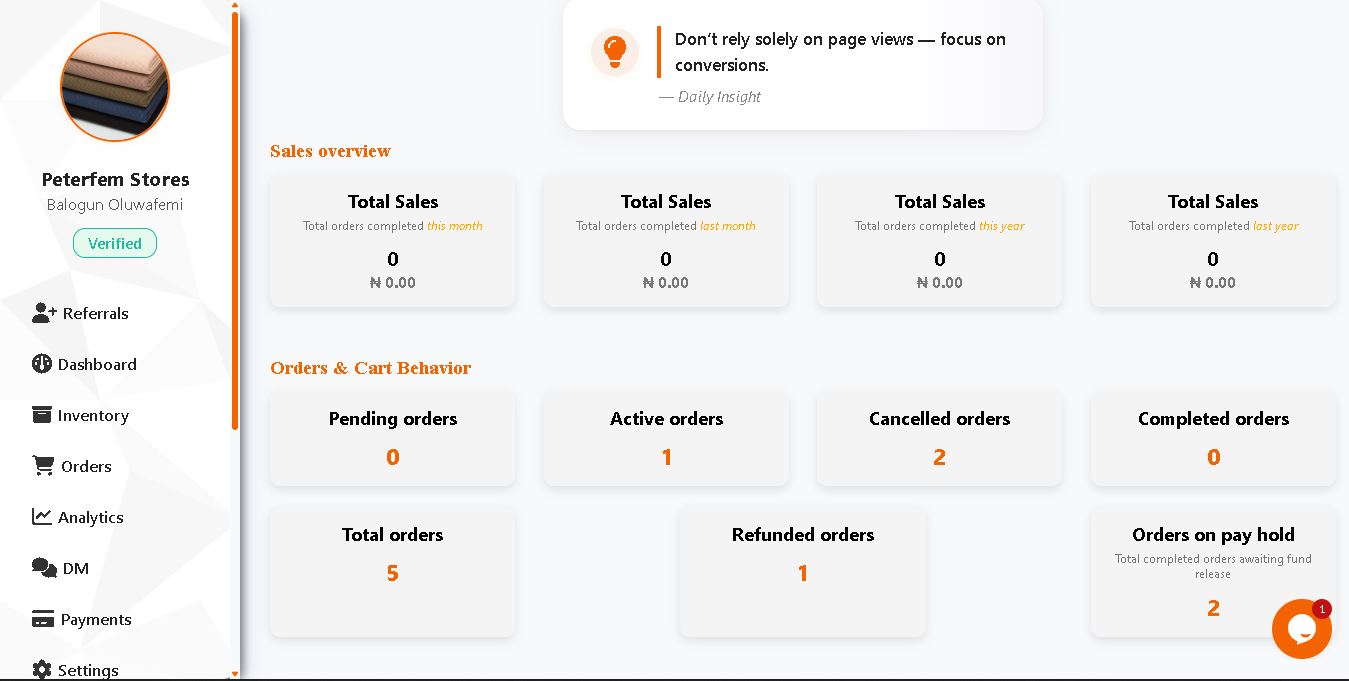
Total Sales: See the Bigger Picture
Tracking your sales across time periods helps you spot trends and seasonal patterns:
- This month vs last month: Did your latest promotion work? Was there a drop after a price change?
- This year vs last year: Are you growing year-over-year? What product lines are performing better?
Pro Tip: If this month’s sales dropped, dive deeper into:
'Traffic trends (Did visits drop?)''Conversion rates (Did people come but not buy?)''Inventory (Are bestsellers out of stock?)'
Orders & Cart Behavior: Understand Buyer Psychology
This section shows your buyers’ real behaviors, not just their intentions.
- Pending Orders: Orders waiting for action (usually payment or fulfillment)
- Active Orders: In-progress orders, either being packed or shipped
- Cancelled Orders: Learn from these! Were they caused by delays, unclear info, or price changes?
- Completed Orders: Your success record - analyze what products and times brought them in
- Refunded Orders: Use these to improve quality, manage expectations, or rewrite descriptions
Cart Metrics That Matter
- Abandoned Cart Rate: % of people who added to cart but didn’t complete purchase
If this is high: Improve shipping info, add urgency, or simplify checkout
- Checkout Conversion Rate: % of visitors who finish checkout
Track this weekly. If it dips, review checkout flow or payment options.
- Most Abandoned Products: These are red flags. Consider: - Too expensive?
- Not enough details?
- Poor images?
- Poor images?
Fix Tip: Add urgency banners ('Only 3 left'), offer limited-time deals, or rewrite descriptions.
Customer Insights: Know Your Audience
This section gives you a deep look into how many people are visiting, who they are, and how valuable they are to your business.
- Visits (Today, Yesterday, This Week, This Month, This Year): Track engagement and daily peaks
- Total Visitors: Unique people who landed on your store
- Total Customers: People who bought at least once
- Average Order Value (AOV): = Total Revenue ÷ Total Orders
Higher AOV = higher profits per customer. Upsell, bundle, or offer premium versions to grow this
- Average Time Between Purchases:
Helps you schedule retargeting campaigns
- Customer Lifetime Value (CLTV): = Average Order Value × Repeat Purchase Frequency × Average Customer Lifespan
This is the north star metric. Loyal customers are more valuable than one-time shoppers. Focus here.
Store Performance Scorecard: Track Your Business Like a CEO
- Overall Sales Target Achievement: See how close you are to your monthly/quarterly goals
- Sales Target Achievement Per-Item: See which products are on track, and which need attention:
- Item Name
- Target
- Sales Achieved
- Achievement %
Use this to promote underperforming products via discounts, bundles, or better placements.
- Inventory Turnover Rate: = Cost of Goods Sold ÷ Average Inventory
High turnover = fast-moving stock. Low turnover = possible deadstock.
- Order Fulfillment Speed: Measured in hours or days - aim for same-day or 24-hr fulfillment to delight customers.
- Customer Satisfaction Score: Calculated from reviews, return rates, support feedback. This is your brand reputation in numbers.
Time-Based Trends: Spot Patterns That Power Growth
- Peak Sales Hours: What time do people buy most?
Schedule promos around these hours.
- Sales Trend Graphs:
- Hourly
- Daily
- Weekly
- Monthly
- Yearly
Use these to track promotions, campaign success, or seasonality.
- Customer Activity Heatmap: Shows time of day and day of week when shoppers are most active.
Great for timing ads, emails, flash sales, and push notifications.
Time-Based Trends: Spot Patterns That Power Growth
- Peak Sales Hours: What time do people buy most?
Schedule promos around these hours.
- Sales Trend Graphs:
- Hourly
- Daily
- Weekly
- Monthly
- Yearly
Product & Inventory Stats: What’s Hot, What’s Not
- Most Viewed Products: High impressions but low sales? Your content needs work.
- Fastest Moving Products: These are your rockstars - promote them even harder.
- Slowest Selling Products: Consider bundling, repackaging, or discounting them.
- Stock vs Sales Trend: Trend to spot underperformers or upcoming out-of-stock risks.
- Out of Stock Frequency: Frequent stock-outs mean missed revenue. Add stock alerts and restock reminders.
- Conversion Rate Per Product: = Sales ÷ Views
This is the ultimate truth: does the product sell when people see it?
- Stock Alerts (low/out of stock): Get proactive to avoid disappointing buyers.
Overtime Revenue & Refunds Chart
Compare how much you’re earning vs how much you’re losing in refunds:
- Spot when refunds spike
- Identify which products are causing it
- Fix before they damage your brand or eat into your profit
Top Sellers & Top Refunds
- Top Selling Products: Your flagship items. Promote them everywhere.
- Top Products Refunded: Time for inspection. Either product quality, delivery, or expectations need realignment.
Final Tips for Sellers
- Check Analytics Weekly - Don’t wait for month-end. Monitor in real time.
- Run Experiments, Then Measure - Changed a title? Added a new image? Run it for 7 days, then check analytics.
- Create a Monthly Performance Report
- Revenue vs refunds
- Order fulfillment time
- Order fulfillment time
- Top products - Always Ask: What Action Will This Data Inspire? Analytics is about decisions - not just numbers.